• Following my previous post outlining the decision to embark on a book data visualisation project, work has now commenced on building the interactive application. The first crucial step involved preparing the “Amazon Top 50 Bestselling Books 2009-2019” dataset. This careful preparation ensures the information is ready for use, forming the essential foundation for all the visual displays that will follow. With the book data now properly organised within the project, the journey of creating an interactive experience has begun.

    A key decision at this stage was choosing the right tool to draw the charts. After looking at several options, I settled on Recharts. This particular library works exceptionally well with React, the framework I’m using to build the website. It makes the process of creating charts straightforward and efficient, allowing me to focus on what the data shows rather than getting bogged down in complex drawing instructions. This choice helps ensure the visualisations are clear and perform smoothly.

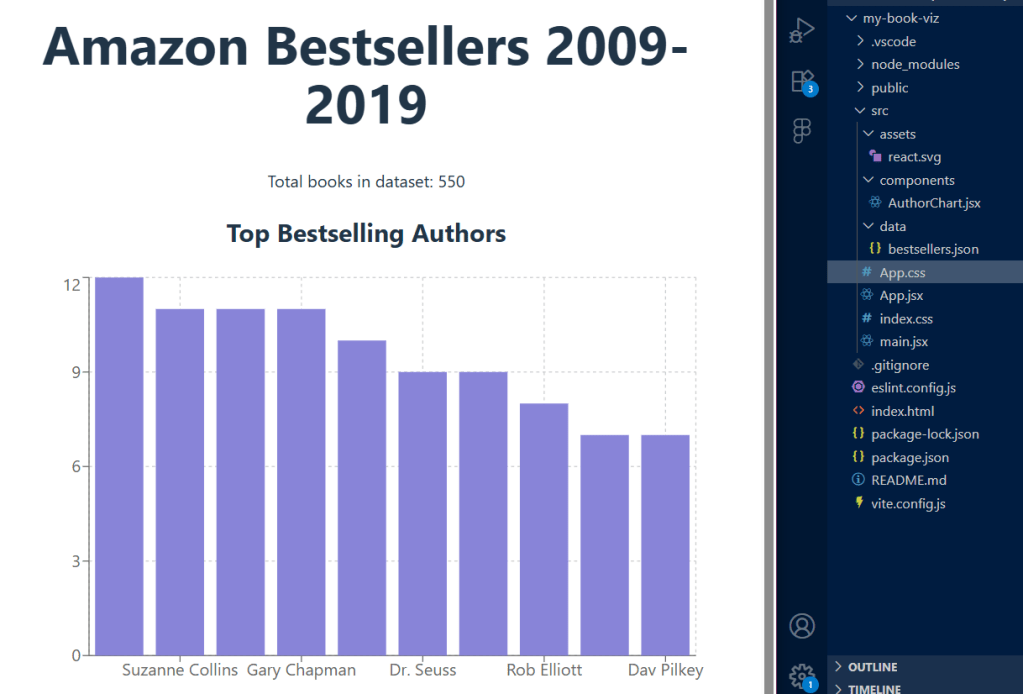
    The first part of the project involves a chart showing the top bestselling authors. To create this, I took the raw book information, counted how many times each author appeared on the bestsellers list, and then arranged that information. This prepared data is then used by Recharts to automatically draw a clear bar chart, immediately showing which authors were most popular over the decade. Getting this first chart to work successfully confirms that the data is flowing correctly and the chart-drawing tool is integrated properly.
    The next stage of development will involve creating more visualisations to explore different aspects of the book data. Each new insight will require me to prepare the data in a specific way and then build a new section for the website to display it. For example, I will be creating a line chart to illustrate how the average reader ratings of bestsellers have changed year by year. This will offer a clear view of how public opinion on books has shifted over time. Additionally, a pie chart will be designed to show the split between fiction and non-fiction books within the dataset, providing a simple way to see genre dominance. These additions will not only make the application more insightful but also demonstrate my ability to handle different types of data presentation.

    Future plans include adding interactive features, allowing visitors to easily filter the data by criteria such as publication year, genre, or reader rating. This commitment to an engaging user experience, alongside a consistent documentation of each development milestone on this blog, highlights the comprehensive nature of this portfolio project.

    +
  • After careful consideration of my next portfolio project, I am now proceeding with a data visualisation initiative that will demonstrate my full-stack and user experience design capabilities. The objective of this project is to create a compelling, long-term asset that not only showcases my technical skills but also provides a structured foundation for my blog content.

    Initially, I had planned to develop a music data visualization tool using a Kaggle dataset. This concept offered a clear pathway for demonstrating key front-end skills. However, upon further review, I determined that a more personal and data-rich subject would lead to a more impactful and unique outcome. Instead, I have decided to pivot the project to focus on book reading habits.

    I will be utilising a Google dataset that I have previously engaged with, which is currently hosted on my GitHub. This dataset is a superior choice, as it provides a comprehensive range of data points beyond simple titles and authors, including publication dates, genres, and reader ratings. This shift in focus ensures a deeper and more meaningful analysis, allowing for the development of a more sophisticated application.

    The project will be built using React, with the primary goal of creating a series of interactive data visualizations. I intend to leverage a charting library such as Nivo or Recharts to present the data effectively, from a chronological timeline of my reading history to heatmaps illustrating genre preferences over time. My background in UX design will be critical in ensuring that the visualisations are not only accurate but also intuitive and user-friendly. This project provides a robust platform for demonstrating my ability to manage complex datasets, construct a resilient front-end, and design a compelling user experience.

    Throughout the development process, I will be documenting my progress on this blog. My posts will detail the project’s evolution from its inception to its final implementation. I will cover technical challenges and their resolutions, from setting up the React environment to the methodologies employed for data cleaning and the rationale behind my design choices. This project serves as an opportunity to both refine my technical skills and articulate a compelling story through data.

    +
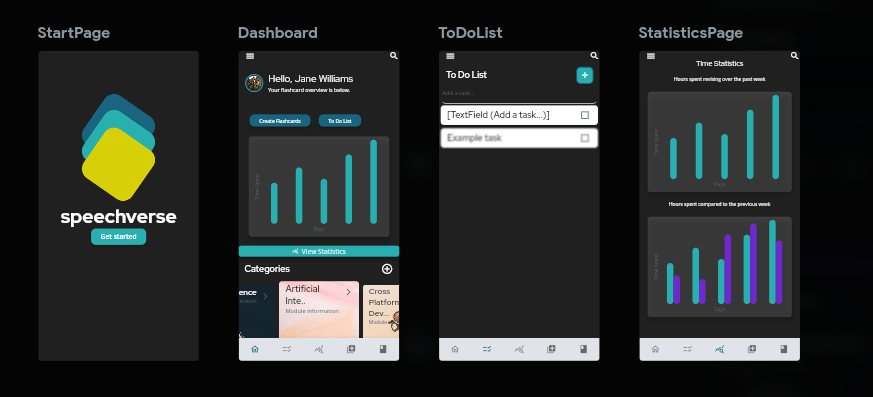
  • High fidelity wireframe for a text to speech learning app:

    Then building on from that wireframe in figma to a more functional prototype in flutterflow:

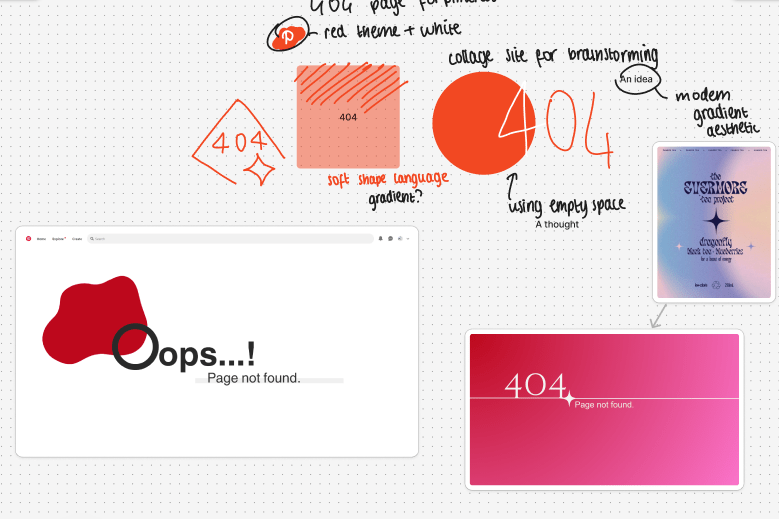
    I noticed that Pinterest does not have an Error 404 page, so I made a few.

    Lastly, a promotional campaign for a modelling shoot, which you can find here.

    +
  • Hi, I’m Emmanuella! I’m excited to share my thoughts, projects, and insights here on my blog. Whether you’re a fellow developer, someone curious about back-end and full-stack development, or just stopping by, welcome!

    My journey into tech started with a passion for problem-solving and creating things that work. After completing my degree in Computer Science and exploring teaching, I found my real love in building scalable and efficient applications as a back-end and full-stack developer. From designing APIs to working with databases, I enjoy the behind-the-scenes work that powers the apps and websites we all use.

    I’ve started this blog to document my growth as a developer, share what I’m learning, and help others who might be on a similar path. Whether it’s exploring new technologies, tackling challenges in projects, or sharing tips and tutorials, I want this to be a space for learning and collaboration.

    I’d love to hear from you! If you’re interested in collaborating, have questions, or just want to say hi, feel free to reach out via my contact page. And if any of the topics I mentioned resonate with you, stick around—I’ve got some exciting posts coming up soon!

    +